
Release
From strategy to development, followed by deployment.
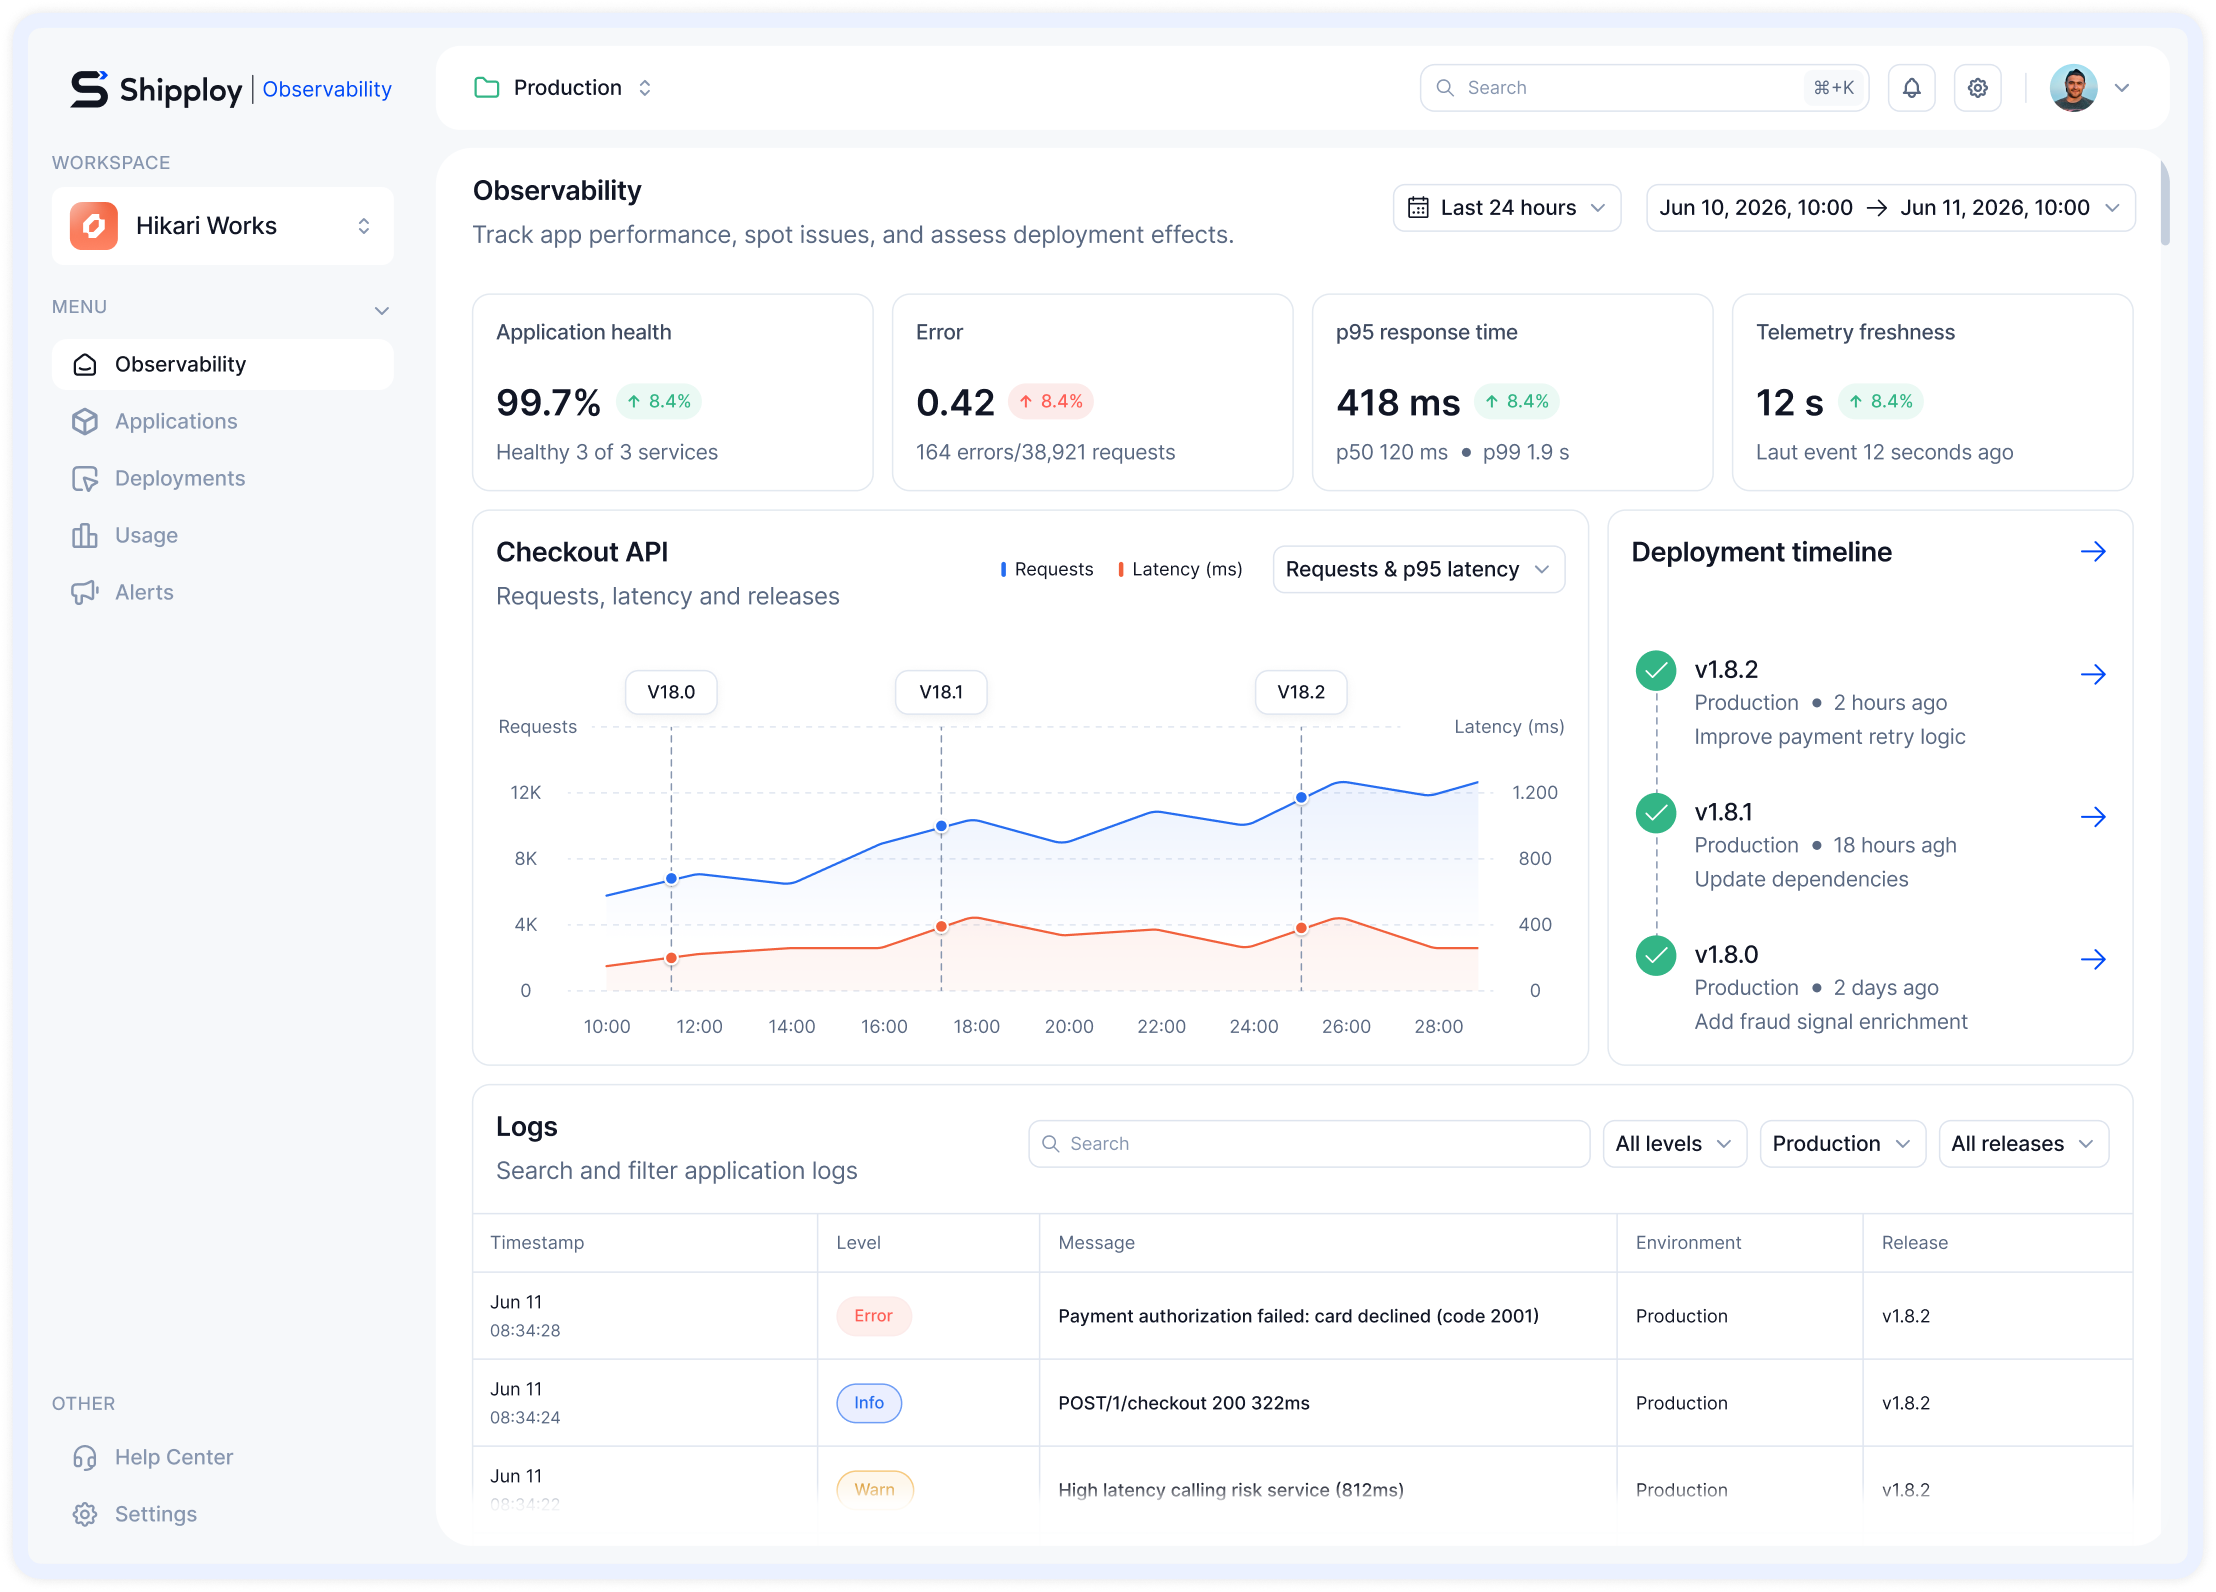
See the health, performance, and runtime evidence behind each Shipploy application, with the release context that explains what changed.
From strategy to development, followed by deployment.
From strategy to development, followed by deployment.
From strategy to development, followed by deployment.
From strategy to development, followed by deployment.
Easily deploy and scale your apps with Shipploy, simplifying the process. Save time by avoiding repetitive K8s configurations.
Separate running infrastructure, observed health, and signal freshness. An app without fresh data does not quietly look healthy.
See which version is serving, which candidate failed, and when behavior changed. A failed release never becomes the story of the app that is running.
See which version is serving, which candidate failed, and when behavior changed. A failed release never becomes the story of the app that is running.
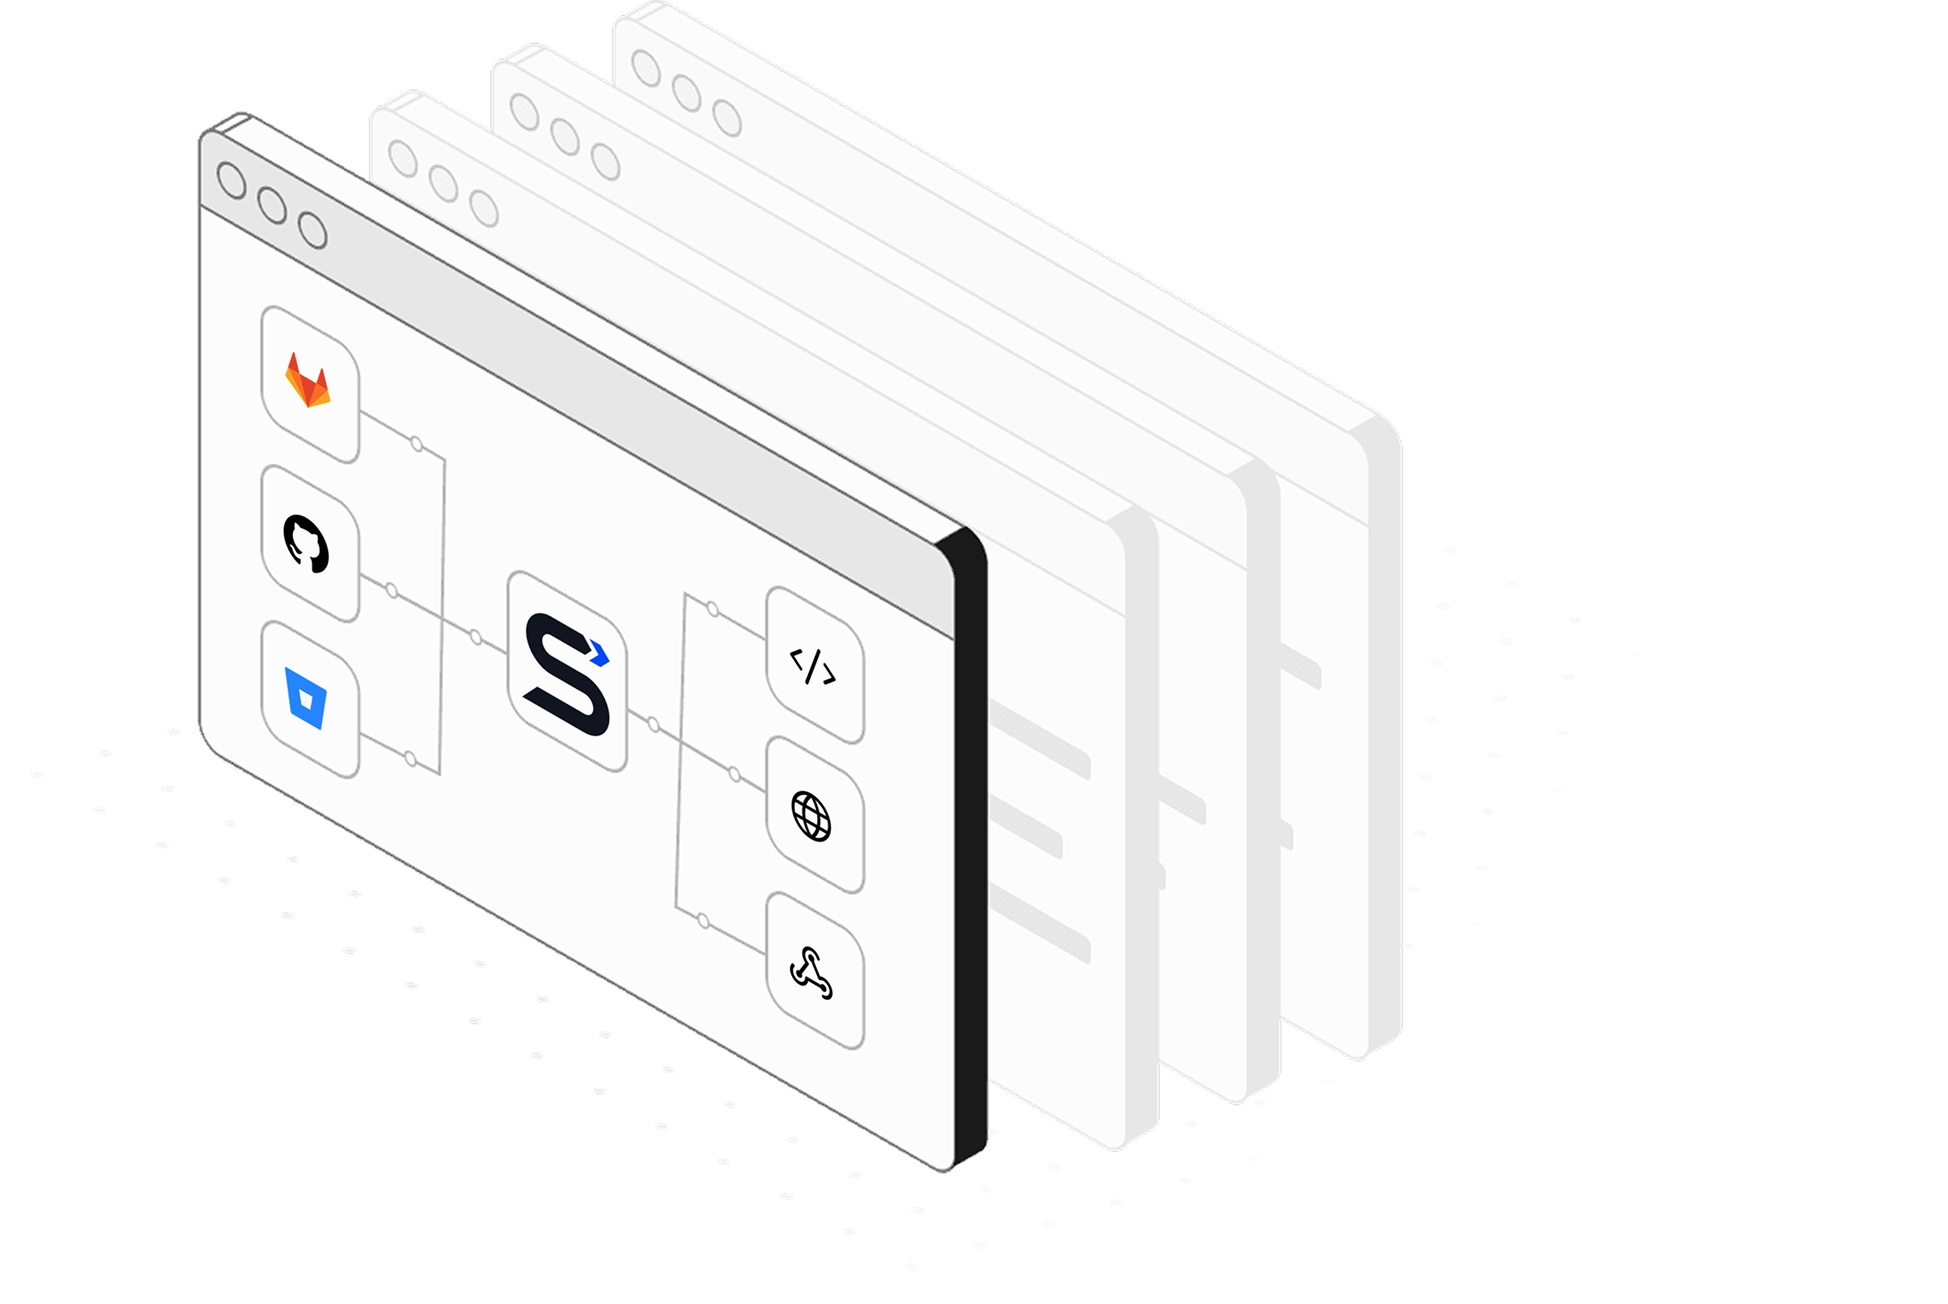
Generic dashboards make you reconstruct a deployment story by hand. Shipploy starts with the application and makes the release a first-class part of the investigation.
Explore documentationSearch the runtime signal tied to a release.
See real runtime behavior as support is verified.
Understand the evidence behind a condition.
Follow a request when instrumentation is enabled.
Quickly set up your workspace, link a repo, and launch in minutes!
Get started for free